
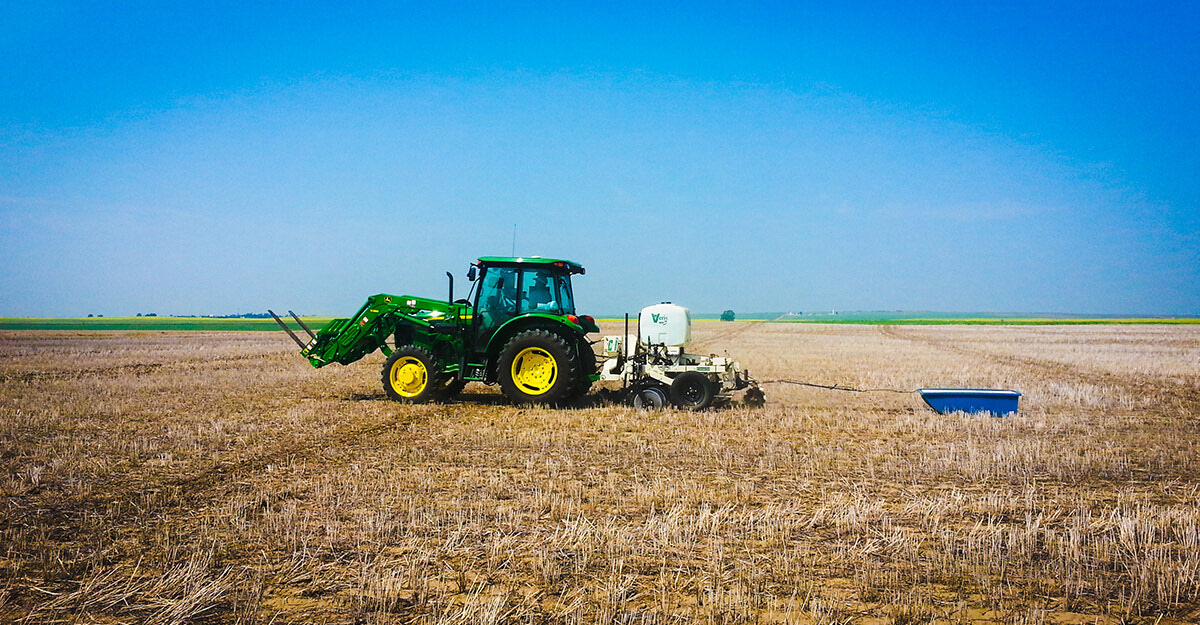
Project AbstractConsiderable effort and money has been invested into precision ag technologies, but clear evidence of improved outcomes are lacking due to the complexity involved in applying and evaluating sound agronomy with these technologies. The demonstration of simple and feasible protocols for site-specific management would be a benefit to the industry. Two soil mapping instruments (EM38, Veris) were evaluated. Maps obtained with these instruments were combined with farmer knowledge, historical yield maps, remote sensing data and topography to delineate two to five management zones per field. Soil properties, water use and crop yields will be monitored at four to six locations of each zone for two cropping seasons. In the second cropping season, simple tests will be conducted to evaluate the recommended site-specific management option for each field. The results were analyzed to provide a protocol to implement and evaluate site-specific management prescriptions. |
|
||||||||||
Project Objectives
|
|
|
|
|
Methods |
||||||||||||
|
|
|||||||||||
MeasurementsThere were two types of data collected for this project; mapped data, which are data collected with sensors or yield monitors across the whole field, and measured data, which are data collected by taking actual measurements of soil properties. |
||||
| Mapped Data | Measured Data | |||
|
|
|
|
|
|
|
|
|
|
|
|
|||
Results
Plant height, NDVI, and crop biomass, on the other hand, were significantly impacted by the simulated hail timing and severity in all crops. Effect of hail severity on plant height differed depending on the timing of hail simulation as indicated by significant interaction between hail timing and severity.
Objective 1: Evaluate two sensor-based soil mapping tools for ease of use, accuracy, consistency, and utility
The research team found that the EM38 was easier to use and produced higher quality electrical conductivity(EC) data than the Veris. However, both sensors produced highly effective mapped EC data. EC maps from both sensors were consistent over space, time, and across sensors. The study also found that although EC data was dependable for mapping the texture and moisture of soil, it was not effective predictors of soil nutrient properties such as NPKS. The specific results leading the research team to these conclusions are detailed in the following sections:
Objective 2: Determine relationships between soil properties, soil moisture availability, and crop yields for identified soil management zones
The study addresses most of the elements of this objective in other sections of the report. The relationships between soil properties, mapped variables and crop yields are closely examined in Objective 1. Performance of identified soil management zones in the context of both productivity and response to nitrogen are discussed at length in Objective 4.
The study used soil samples to examine the soil properties of the management zones created. This analysis found that soil properties tied to management zones closely mirrored the results of the correlation analysis described in the summary of Objective 1. Management zones built using EC, for example, tended to contain soil with different soil moisture and texture properties for each zone. The soil management zones used in this study did not, however, effectively differentiate soil nutrient properties.
Objective 3: Identify and evaluate protocols to delineate soil management zones based on multiple sources of information
The project focused on two elements in developing protocols for zone delineation: 1) Which data sources to use, and 2) How to effectively use these data to create zones. Principal Component Analysis (PCA) identified key data layers for zone delineation and cluster analysis objectively defined zones.
Objective 4: Identify and test the top recommended management option that could be variably managed
The project generated response curves documenting the response of yield to increasing rates of nitrogen for each zone in all five different methods of zone delineation. The research team examined these curves to assess the effectiveness of each delineation method. There are two scenarios that indicate meaningful or useful zones. The first is if the mean yields of identified zones differ significantly. The second is if crop yield response to nitrogen differs for each zone. The five different zone delineation methods tested were surface geography, grid soil sampling, historic yield, EC and a composite of yield and EC.
Conclusion
This project had a strong focus on collection and analysis of on-farm data. The researchers found it easy to gather large quantities of data. Converting that data into tangible knowledge proved more challenging. Data and analysis must provide information that is consistently reliable in order to be used for good decision making. The knowledge generated by this study provides strong guidelines for collection, analysis, and application of spatial on-farm data. It also places limitations on the on the ways data can facilitate good management decisions. The implications of the study results are summarized three sections: 1) data and soil variability, 2) data and yield prediction, and 3) zone delineation and VR management.
Recommendations
The study determined that variable rate technology requires a variable approach. Temporal and spatial variability in soil properties, yield, weather and other factors produce a complex and dynamic system that is difficult to understand, predict and manage. Additionally, every field is unique and responds differently to various management strategies. There is no magic formula or universal approach that can consistently identify meaningful and manageable zones.
Variable rate practitioners must evaluate zone delineation methods with the in-farm research design used in this project to allow for an objective evaluation of any variable rate management approach in any field. Mapped electrical conductivity may be the most useful data to understand the variability of soil properties. Yield data is also an effective variable, but its efficacy can be limited by data quality and temporal variability in yield patterns. Producers are advised to take meticulous care to ensure yield data is accurate and dependable.
More academic work is needed before variable rate nitrogen can be recommended as a consistently effective crop management strategy.
Media
Check out our playlist on this exciting project!