Methods
|
Collaborators
|
| Farming Smarter |
Research Project Leads |
| Western Ag Innovation |
Economic Analysis |
| Dennis Dey Consultings |
Scientific Support & Soil Nutrient Testing |
Locations
|
| Lethbridge |
| Barons |
| Stirling |
| Taber |
|
Treatments
|
|
This project will be carried out over a four-year period and will include four trials as follows, with management practices and quality analyses for each trial outlined in table 1:
|
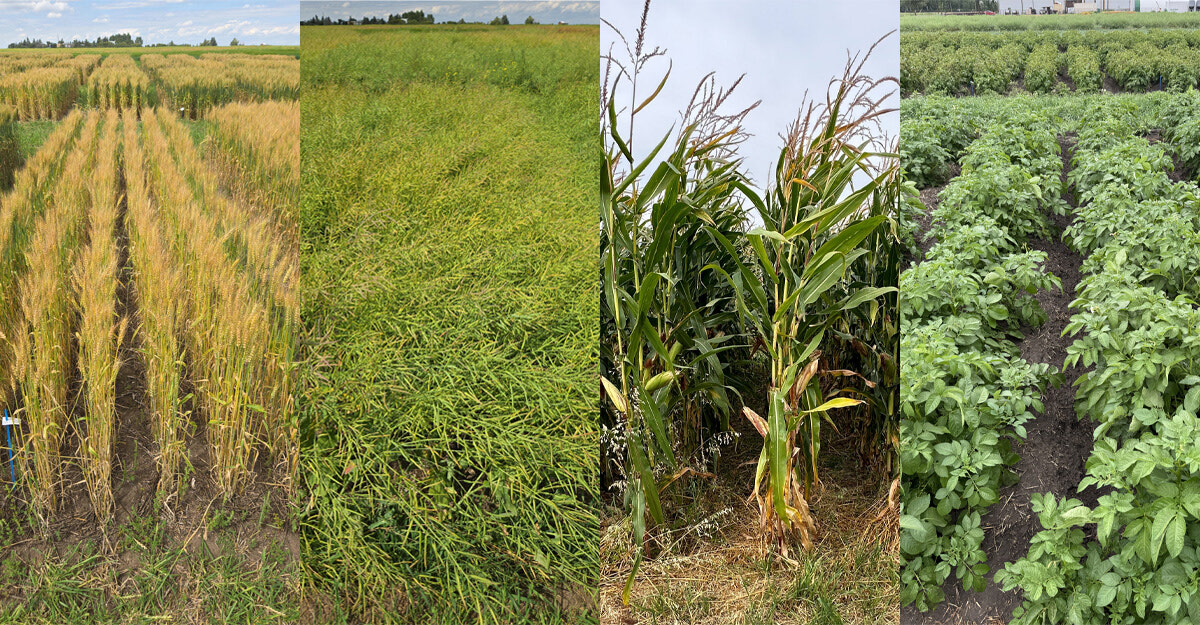
- Trial 1: Irrigated Canola
|
|
|
|
|
- Trial 4: Irrigated Potatoes
|
| The trials will take place across up to three locations each year, ideally within fields managed with the same crops for a total of at least 10 site-years per crop (see table 2). The fields selected will be in a low nutrient state prior to starting the trials, as tested by soil sampling. |
|
|
Each trial will have a Factorial arrangement of Randomized Complete Block Design with two factors that follow the 4Rs:
| Right source & Right Place as recommended for each crop: |
Right Time: |
Right Rate |
- Nitrogen:
- Potatoes - broadcast urea with seedbed preparation
- Corn - in-row starter with phosphorus, side-band urea
- Wheat & Canola - shallow side-banded with low in-row starter application, followed by in-crop top dressing
- Phosphorus:
|
|
- Nitrogen (kg/ha actual N):
- 5 rates per crop - 0, 50, 100, 150, 200
- Phosphorus:
- 2 rates per crop - base (recommended industry standard) and boosted (150% recommended)
- Other nutrients:
- applied at the recommended rates as per soil test results
In total there will be 2 X 5 = 10 treatments per crop
|
Soil samples from each site will be submitted to a local soil testing laboratory to determine:
- the N soil test level in each field, which will determine its suitability for developing N recommendations (i.e., low soil test levels are preferable for the development of yield response curves), and
- the soil test levels of other nutrients (e.g., potassium, sulphur or zinc) that will have to be applied to avoid other nutrient deficiency.
|
Table 1: Management descriptions for each of the four trials
|
| Crop |
Tillage +Seeding
|
Plant density
(plants sq ft) |
Fertilizer |
Harvest |
Quality analysis |
| Trial 1: Commercial Canola |
Conservation till, planter, 9" row width |
8 |
In-row APP, side band urea |
Direct Cut + Combine |
TKW, Oil Content, green seed (NIR) |
| Trial 2: CWRS Wheat (AAC Brandon) |
No-till, air drill, 9.5" row width |
25 |
In-row APP, side band urea |
Direct Cut + Combine |
Grain protein (NIR), TKW |
| Trial 3: Silage Corn |
Conservation till, planter, 30" row width |
2 |
In-row APP, side band urea |
Forage harvester |
DM, CP, ADF, cattle energy (NIR) |
| Trial 4: Potatoes (Russet Burbank) |
Cultivated, planter + hiller, 36" hill and row width |
3 |
Broadcast urea + MAP |
Potato Digger |
Size profile, specific gravity |
|
Table 2: Number of Locations per year for each trial
|
| Trial |
Year 1
Locations
|
Year 2
Locations
|
Year 3
Locations
|
Year 4
Locations
|
Total
Site-Years
|
| Canola |
3 |
3 |
3 |
3 |
12 |
| Wheat |
3 |
3 |
3 |
3 |
12 |
| Corn |
2 |
3 |
3 |
3 |
11 |
| Potatoes |
2 |
2 |
3 |
3 |
10 |
|
Measurements
Crop yield and crop quality metrics will be determined on a plot-by-plot basis, which will facilitate a rigorous statistical assessment of crop performance in relation to water allocations.
|
- Plant emergence counts (2 x 1m in each plot after establishment)
|
- Crop Vigour (wheat: zadocks 31 and 37, canola: 2-4 leaf and cabbage, potatoes: pre-topping, drybean: 4-6 leaf)
|
|
|
|
- Lodging (if present), compare treatment effects
|
- Crop yield (trim the outer 1m of plot to eliminate edge effects, harvest 2m wide strip or equivalent)
|
- Crop quality (see table 1)
|
|
|
|